netneurotools.plotting.pv_plot_parcellated_data
- netneurotools.plotting.pv_plot_parcellated_data(data, parcellation, template='fsaverage', hemi='both', **kwargs)[source]
Plot parcellated data on the surface of the cortex.
This function converts parcel-level data into vertex-level data using parcels_to_vertices, and then visualizes it on a cortical surface using pv_plot_surface.
- Parameters:
data (array-like or tuple of array-like) – Parcellated data. If hemi is both, this can be a tuple of two arrays (left, right) or a single concatenated array. If hemi is L or R, then it must be a single array.
parcellation (str or Path or tuple/list) – Parcellation file(s). If hemi is both, this can be a tuple/list of two files (left, right), or a single CIFTI (.dlabel.nii) file. If hemi is L or R, then it must be a single file. If a string is provided, it can also specify a built-in atlas:
“schaefer{n}x{k}” (e.g., “schaefer400x7”)
“cammoun{scale}” (e.g., “cammoun033”)
“mmpall”
Use netneurotools.datasets.fetch_schaefer2018, fetch_cammoun2012 and fetch_mmpall to see available resolutions.
template (str, optional) – Surface template to use for plotting. It must match the template of the parcellation file. See pv_plot_surface for available options. Default is ‘fsaverage’.
hemi (str, optional) – Hemisphere to plot. Options: ‘L’ (left), ‘R’ (right), ‘both’. Default is ‘both’.
**kwargs – Additional keyword arguments passed directly to pv_plot_surface.
- Returns:
pl – PyVista plotter object returned by
pv_plot_surface().- Return type:
Examples
Plot Schaefer parcellated data:
>>> from netneurotools.plotting import pv_plot_parcellated_data
>>> data = np.random.rand(400)
>>> pl = pv_plot_parcellated_data(data, 'schaefer400x7')
Plot Schaefer parcellated data using a manually fetched parcellation:
>>> from netneurotools.plotting import pv_plot_parcellated_data
>>> from netneurotools.datasets import fetch_schaefer2018
>>> import numpy as np
>>> parc = fetch_schaefer2018('fslr32k')['400Parcels7Networks']
>>> data = np.random.rand(400)
>>> pl = pv_plot_parcellated_data(data, parc, template="fslr32k")
Examples using netneurotools.plotting.pv_plot_parcellated_data
Network assortativity and distance-preserving surrogates
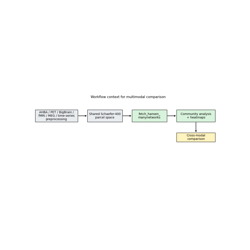
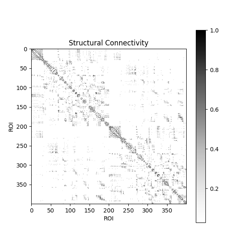
Are brain modules consistent across connectivity modes?